Investing Forum Roma 2026 · Algorithmic trading

EasyLanguage integrated with AI agents (excerpt from the presentation "Technical analysis and programming languages in the era of AI agents" · InvestingRoma 2026)

A programming language for traders like EasyLanguage can be integrated with AI agents: the agent writes, tests and validates, the trader decides and keeps executing in EasyLanguage.

The idea: a seasonality rule in EasyLanguage

This page shows, with a real example, how a programming language like EasyLanguage can be integrated with AI agents without leaving the platform the trader already knows. The topic is a simple seasonality idea written in EasyLanguage and the way an AI agent takes it to a basket of stocks, validates it and returns it in EasyLanguage.

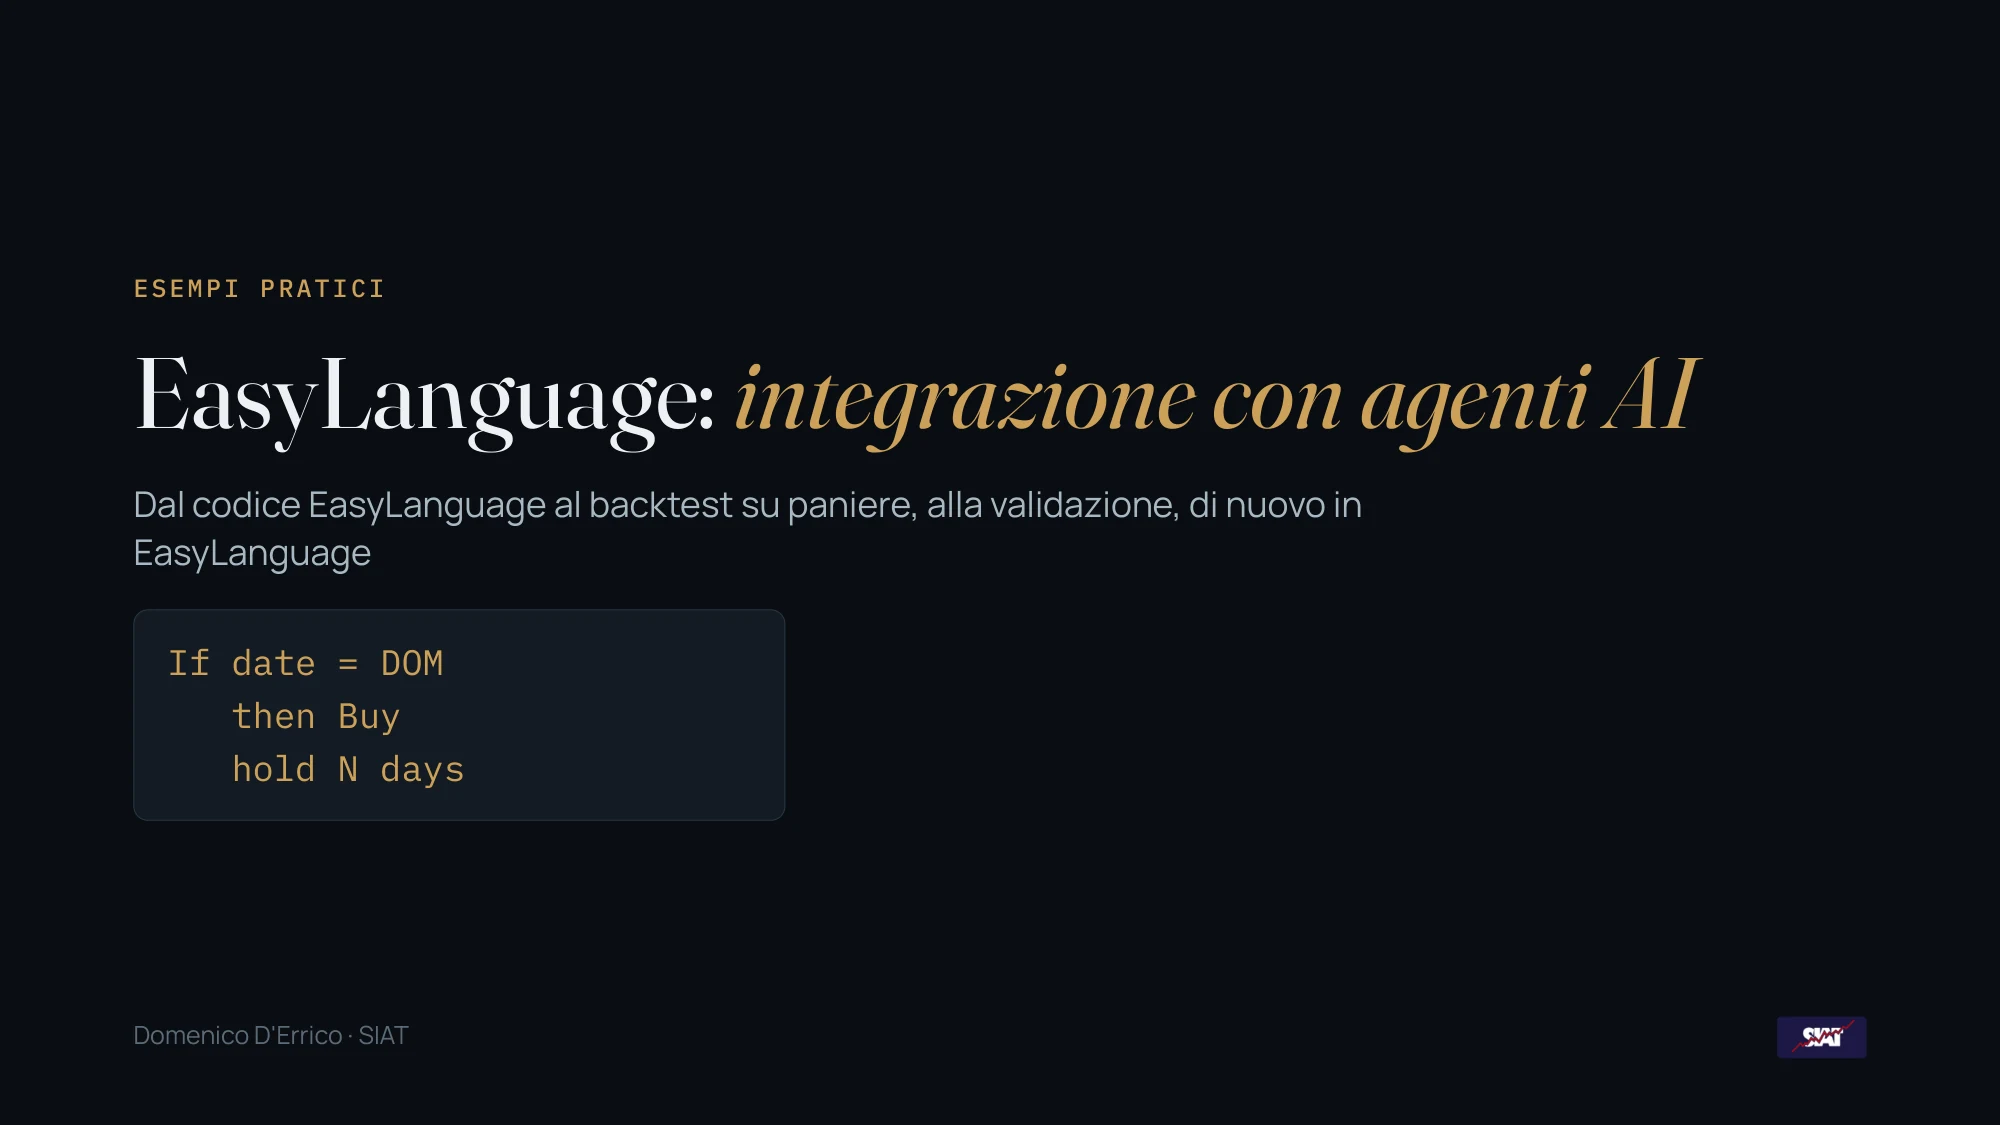
Title slide: EasyLanguage integrated with AI agents, from code to basket backtest, to validation, back to EasyLanguage
Slide 10. Point 2: EasyLanguage integrated with AI agents.
Slide: EasyLanguage, integration with AI agents, with the example rule If date = DOM then Buy hold N days
Slide 11. The starting rule: if the date is day X of the month (DOM), buy and hold the position for N days.

What TradeStation shows and what is missing

Equity line and Optimization Report are the output the trader knows. The images are illustrative, in the TradeStation style, with numbers computed in Python on DIA.
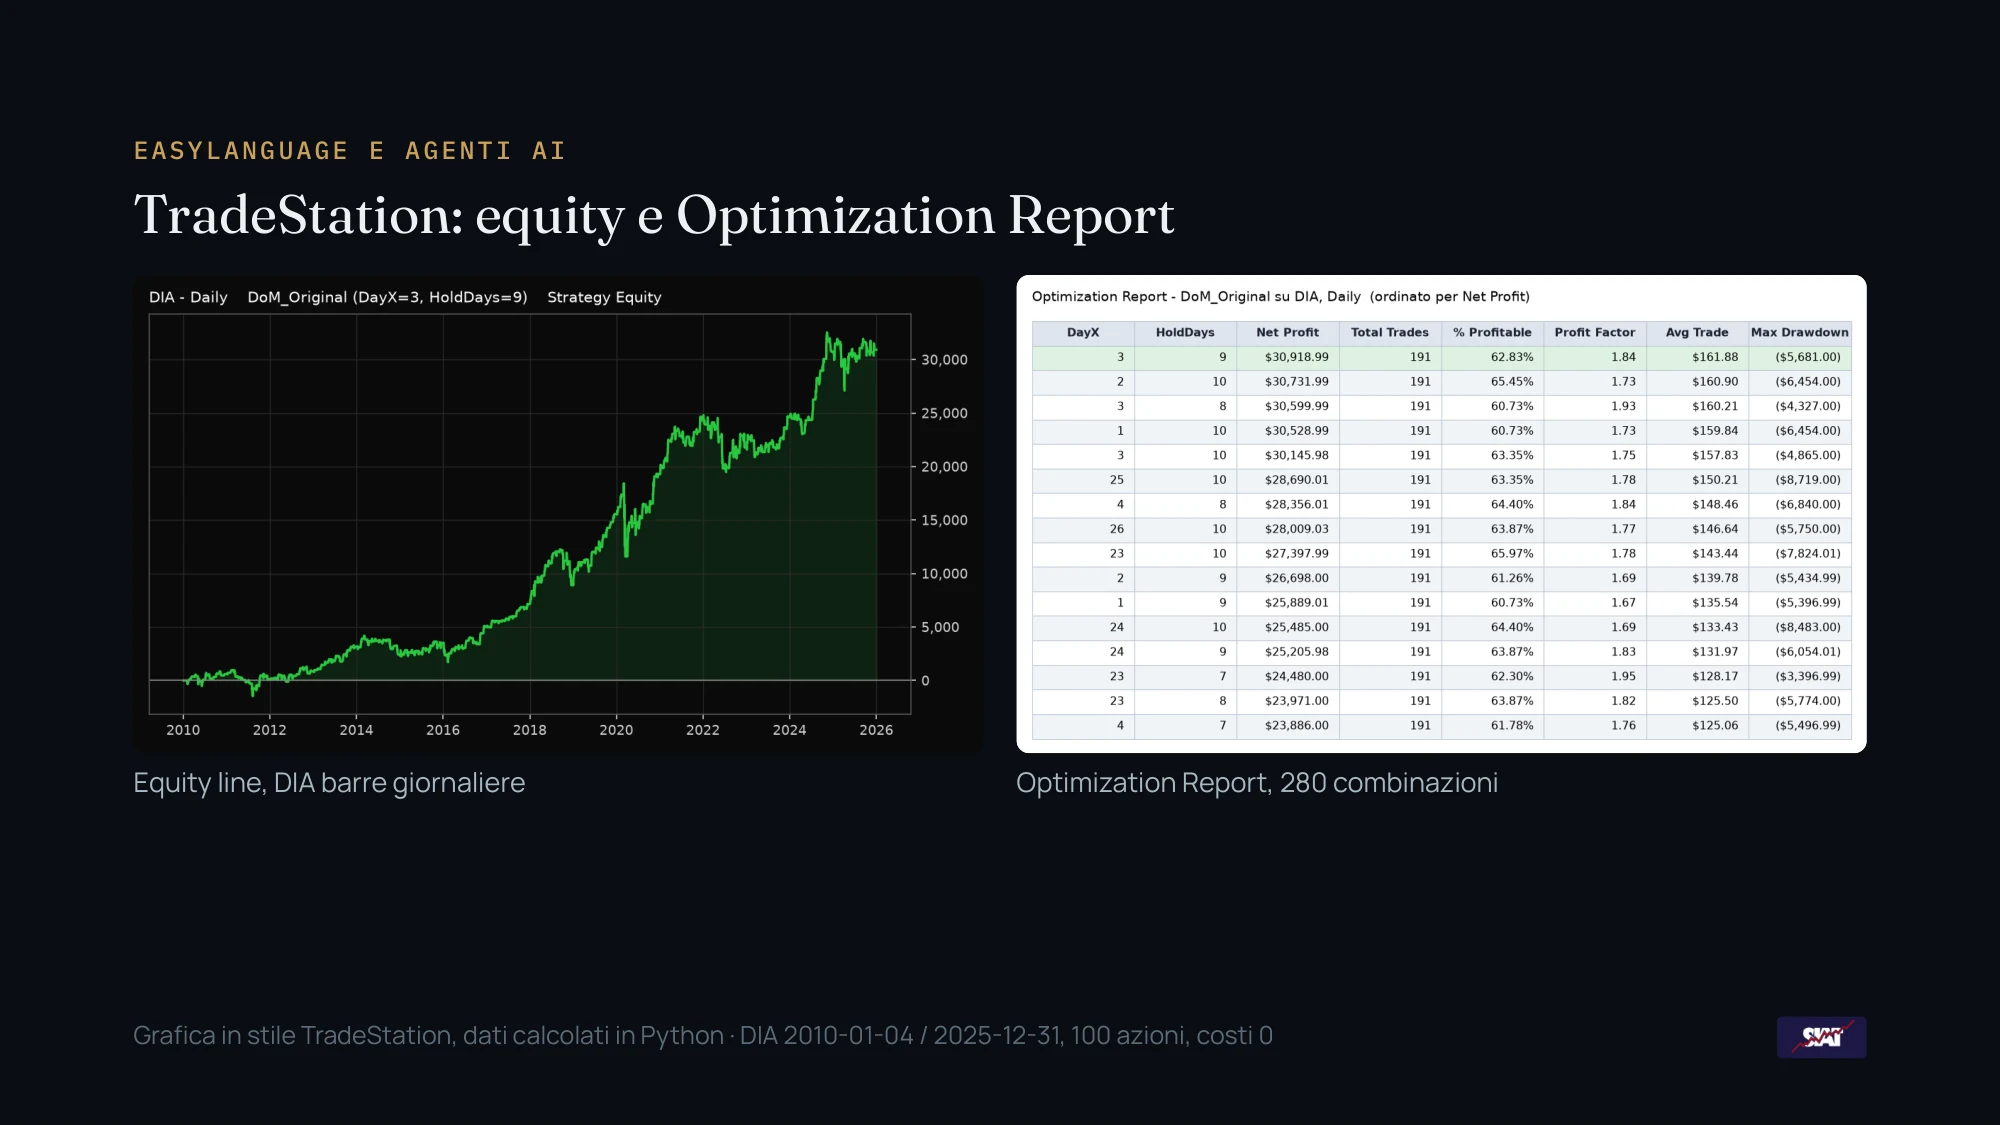
Equity line of the DoM_Original strategy on DIA with daily bars and Optimization Report with 280 DayX and HoldDays combinations
Slide 12. Equity line (DIA, daily bars) and Optimization Report on 280 combinations. DIA 2010-01-04 / 2025-12-31, 100 shares, costs 0.

The TradeStation report describes the strategy in absolute terms. Two things are missing: the comparison with the benchmark, i.e. buy & hold, and the robustness analysis, i.e. how much the result depends on the parameters and on the period.
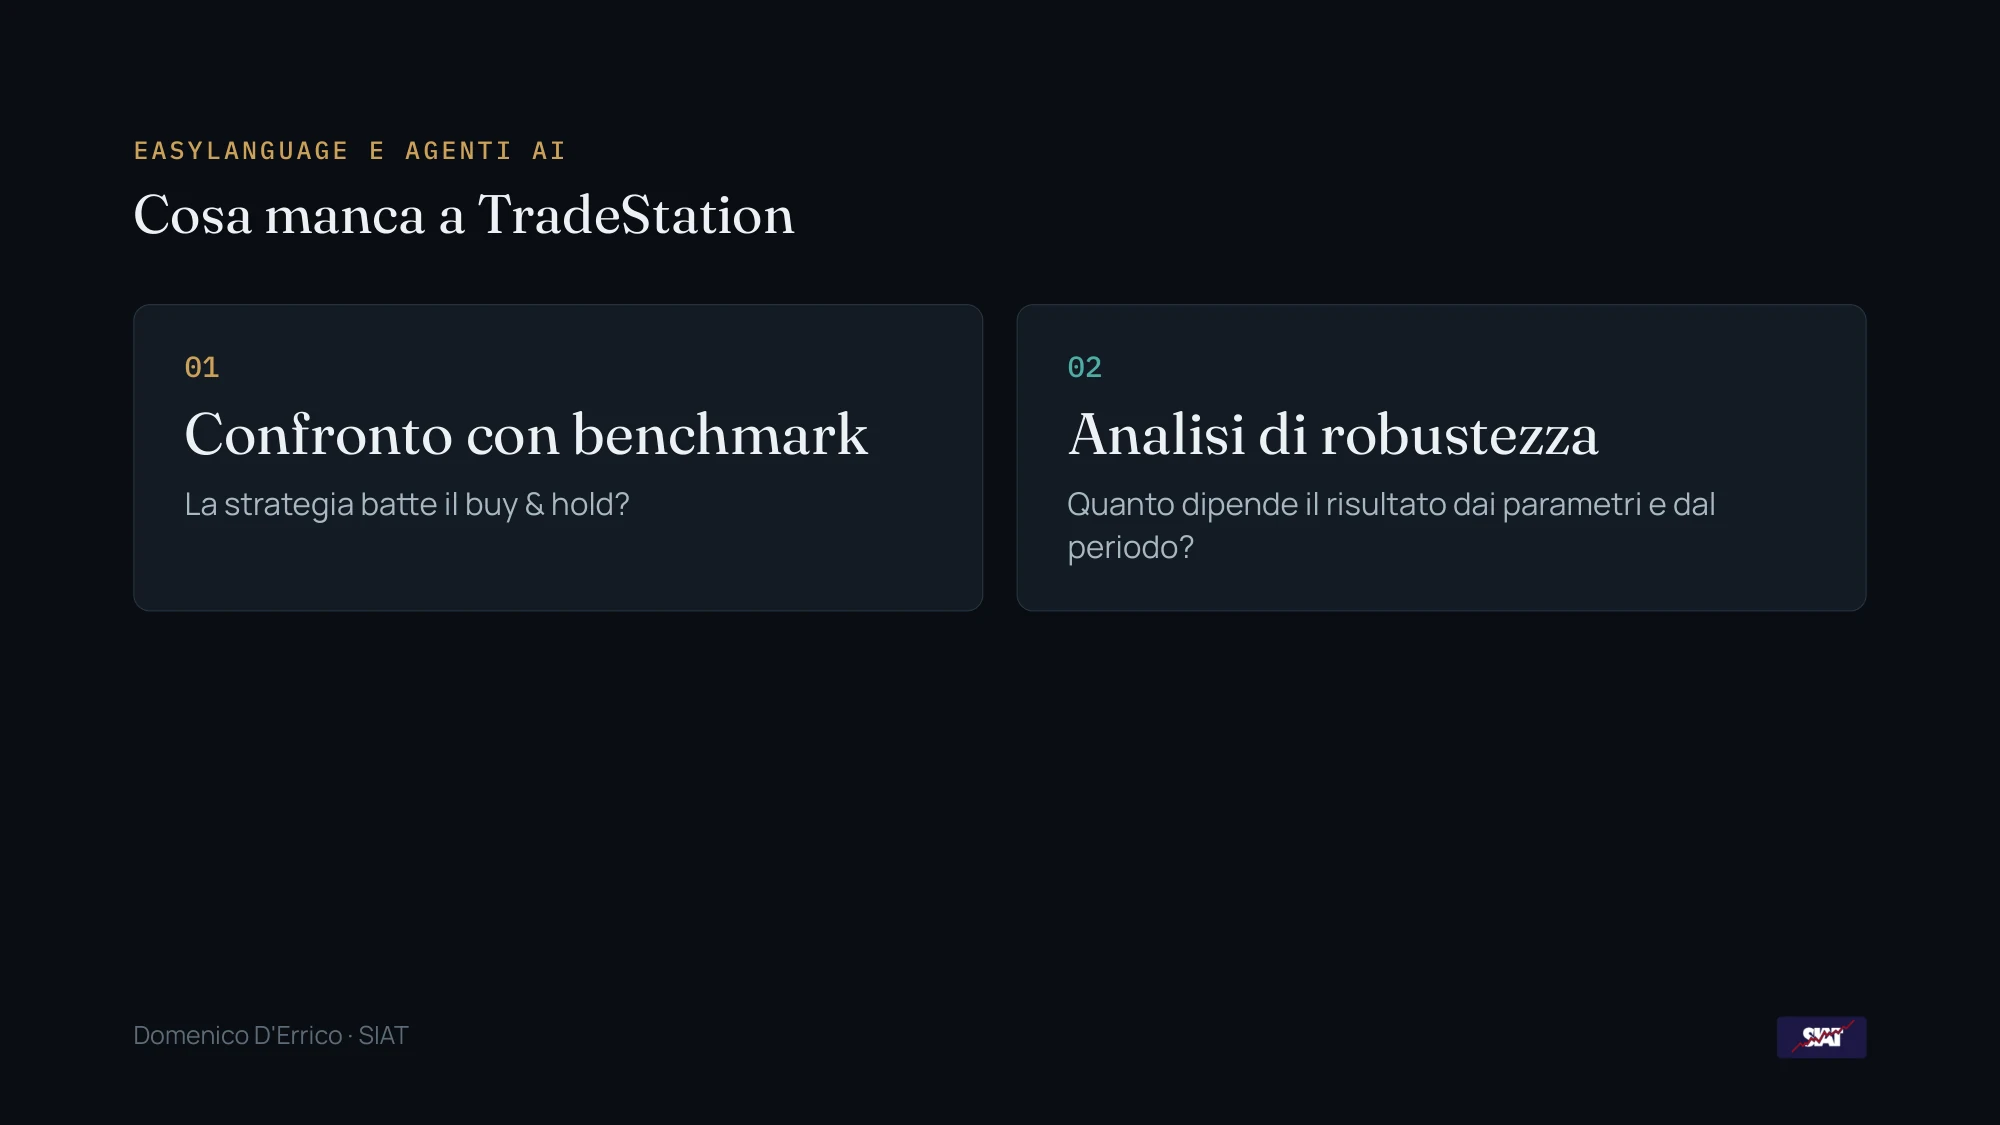
Slide: what TradeStation is missing, the benchmark comparison and the robustness analysis
Slide 13. Two open questions: does the strategy beat buy & hold? How much does the result depend on the parameters and on the period?

Single Python backtest against the benchmark

A single backtest written by an agent in Python: same rule as the EasyLanguage one, compared with buy & hold on DIA.
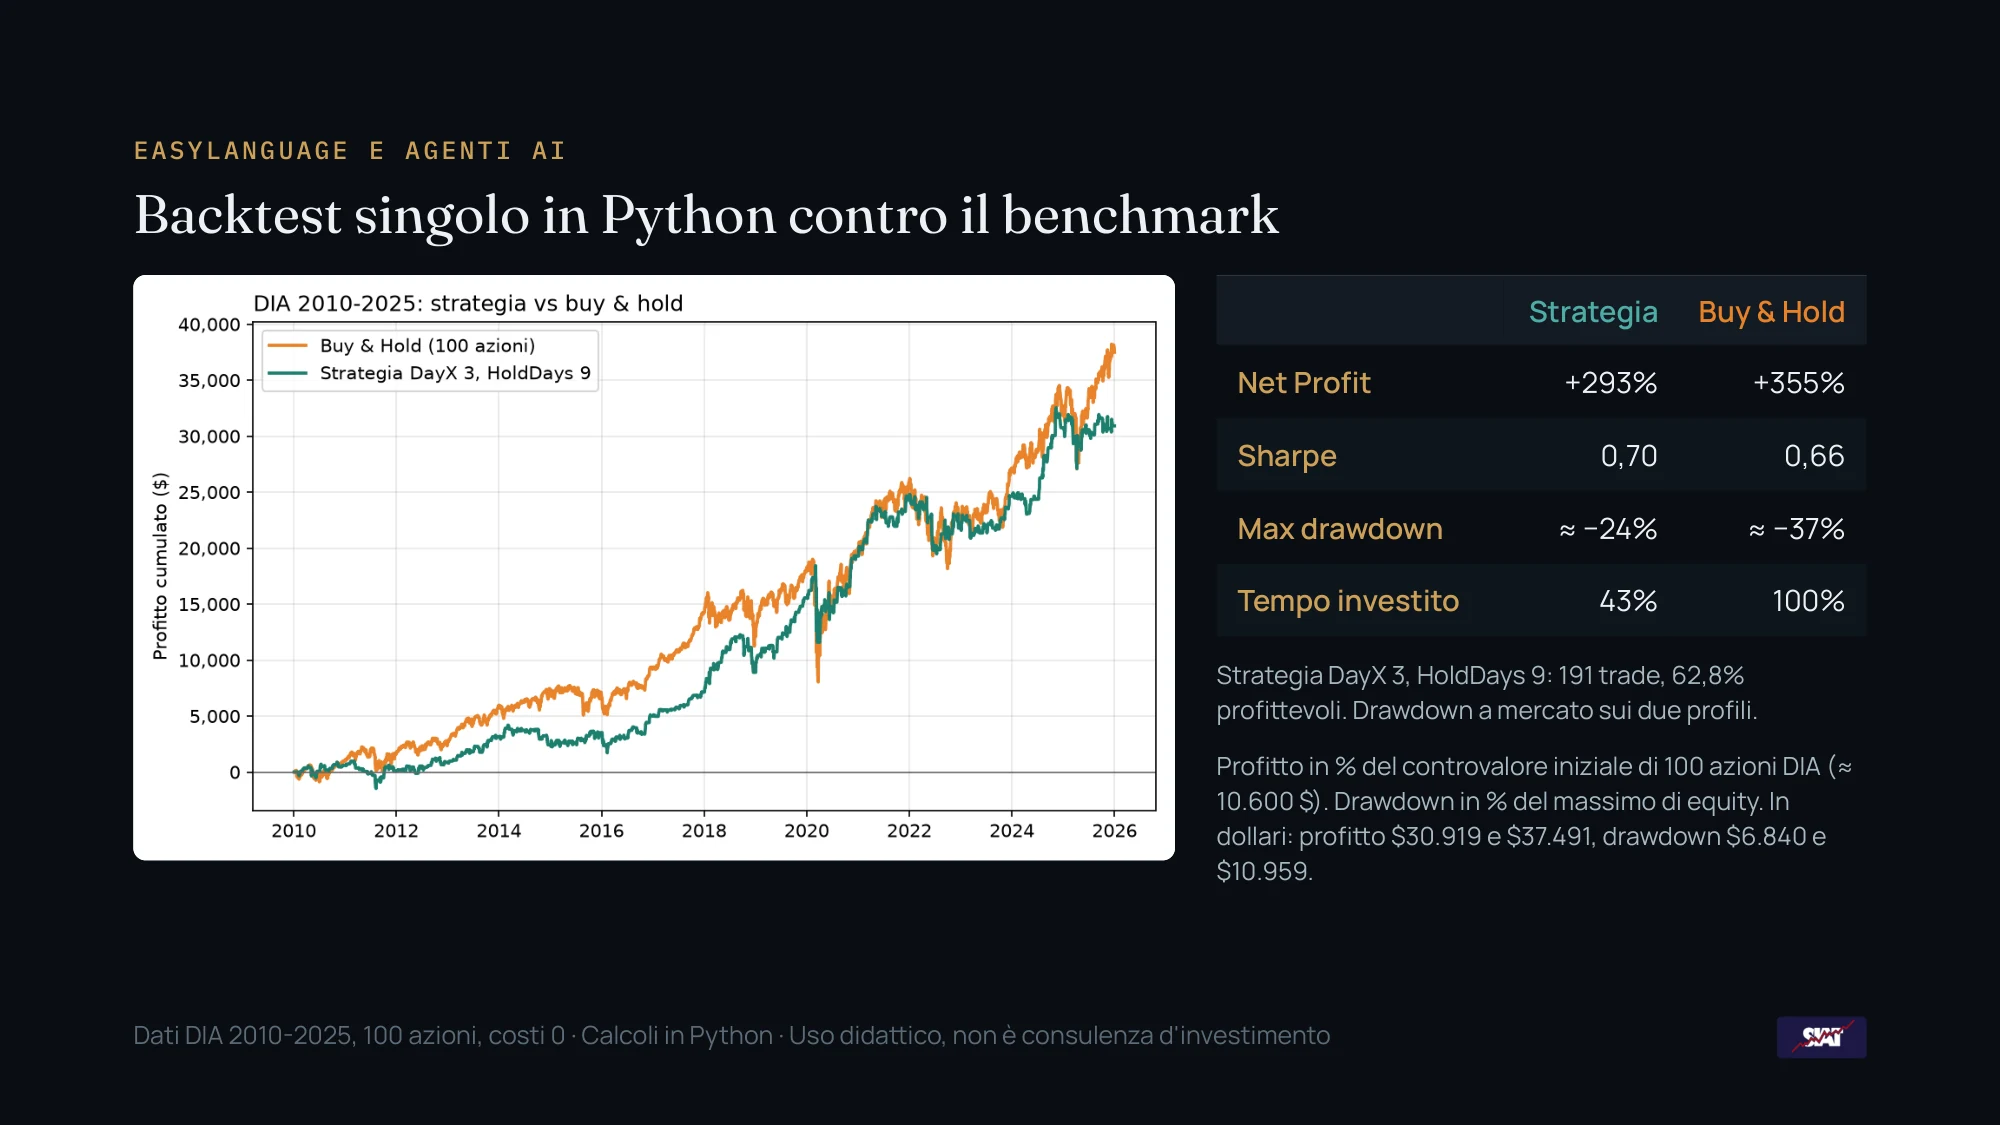
Cumulative profit curve of the DayX 3 HoldDays 9 strategy versus buy and hold on DIA 2010-2025, with a table of Net Profit, Sharpe, drawdown and time invested
Slide 14. Strategy DayX 3, HoldDays 9 versus buy & hold on DIA. Net Profit +293% vs +355%, Sharpe 0.70 vs 0.66, maximum drawdown about -24% vs about -37%, time invested 43% vs 100%. Percentages on the initial value of 100 shares (about $10,600); in dollars: profit 30,919 and 37,491, drawdown 6,840 and 10,959.

The strategy is invested less than half of the time. The Net Profit of buy & hold is higher; the Sharpe and the drawdown of the strategy are better.

Robustness analysis: the grid search

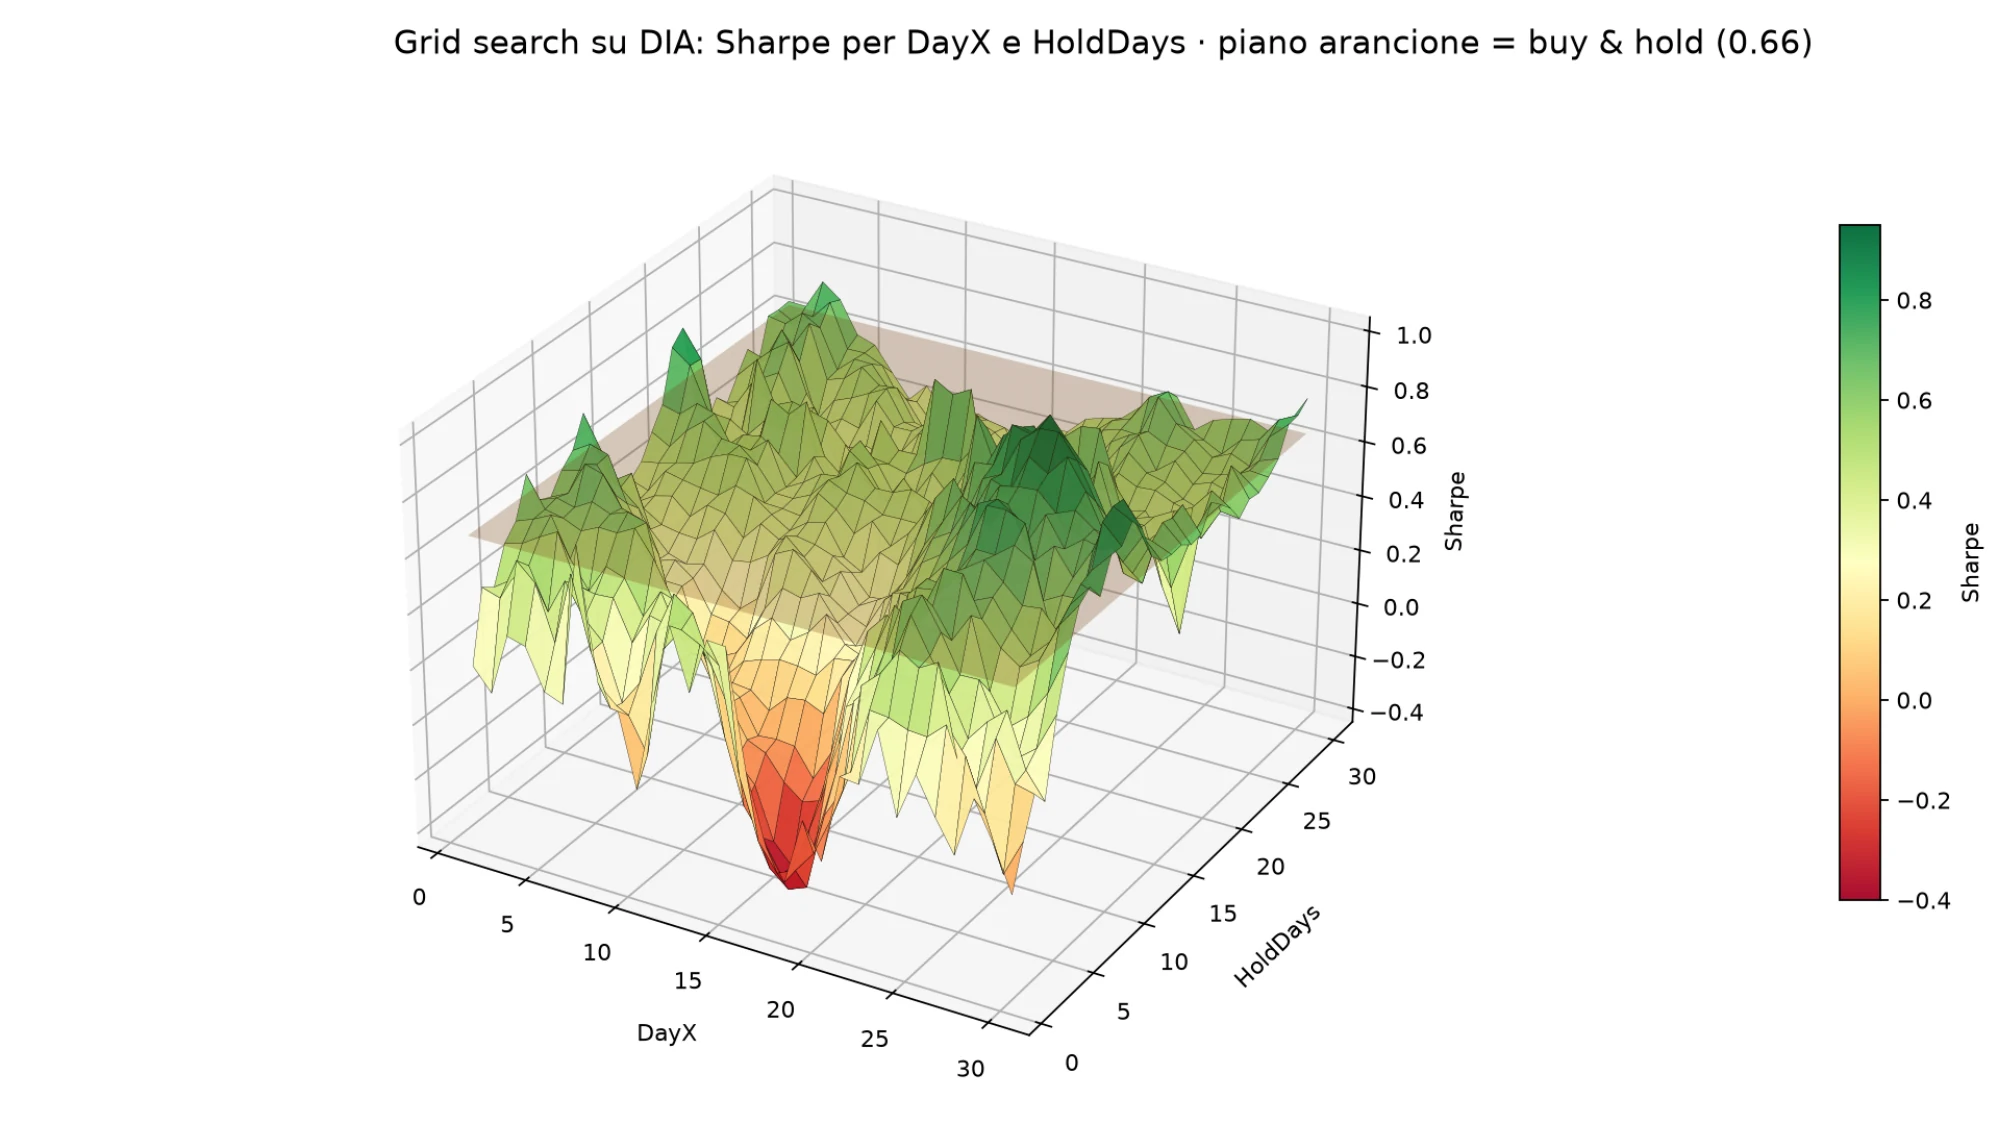
The grid search runs 900 combinations in a few seconds. The Sharpe is read by entry day (DayX) and by holding days (HoldDays), always against buy & hold (0.66).
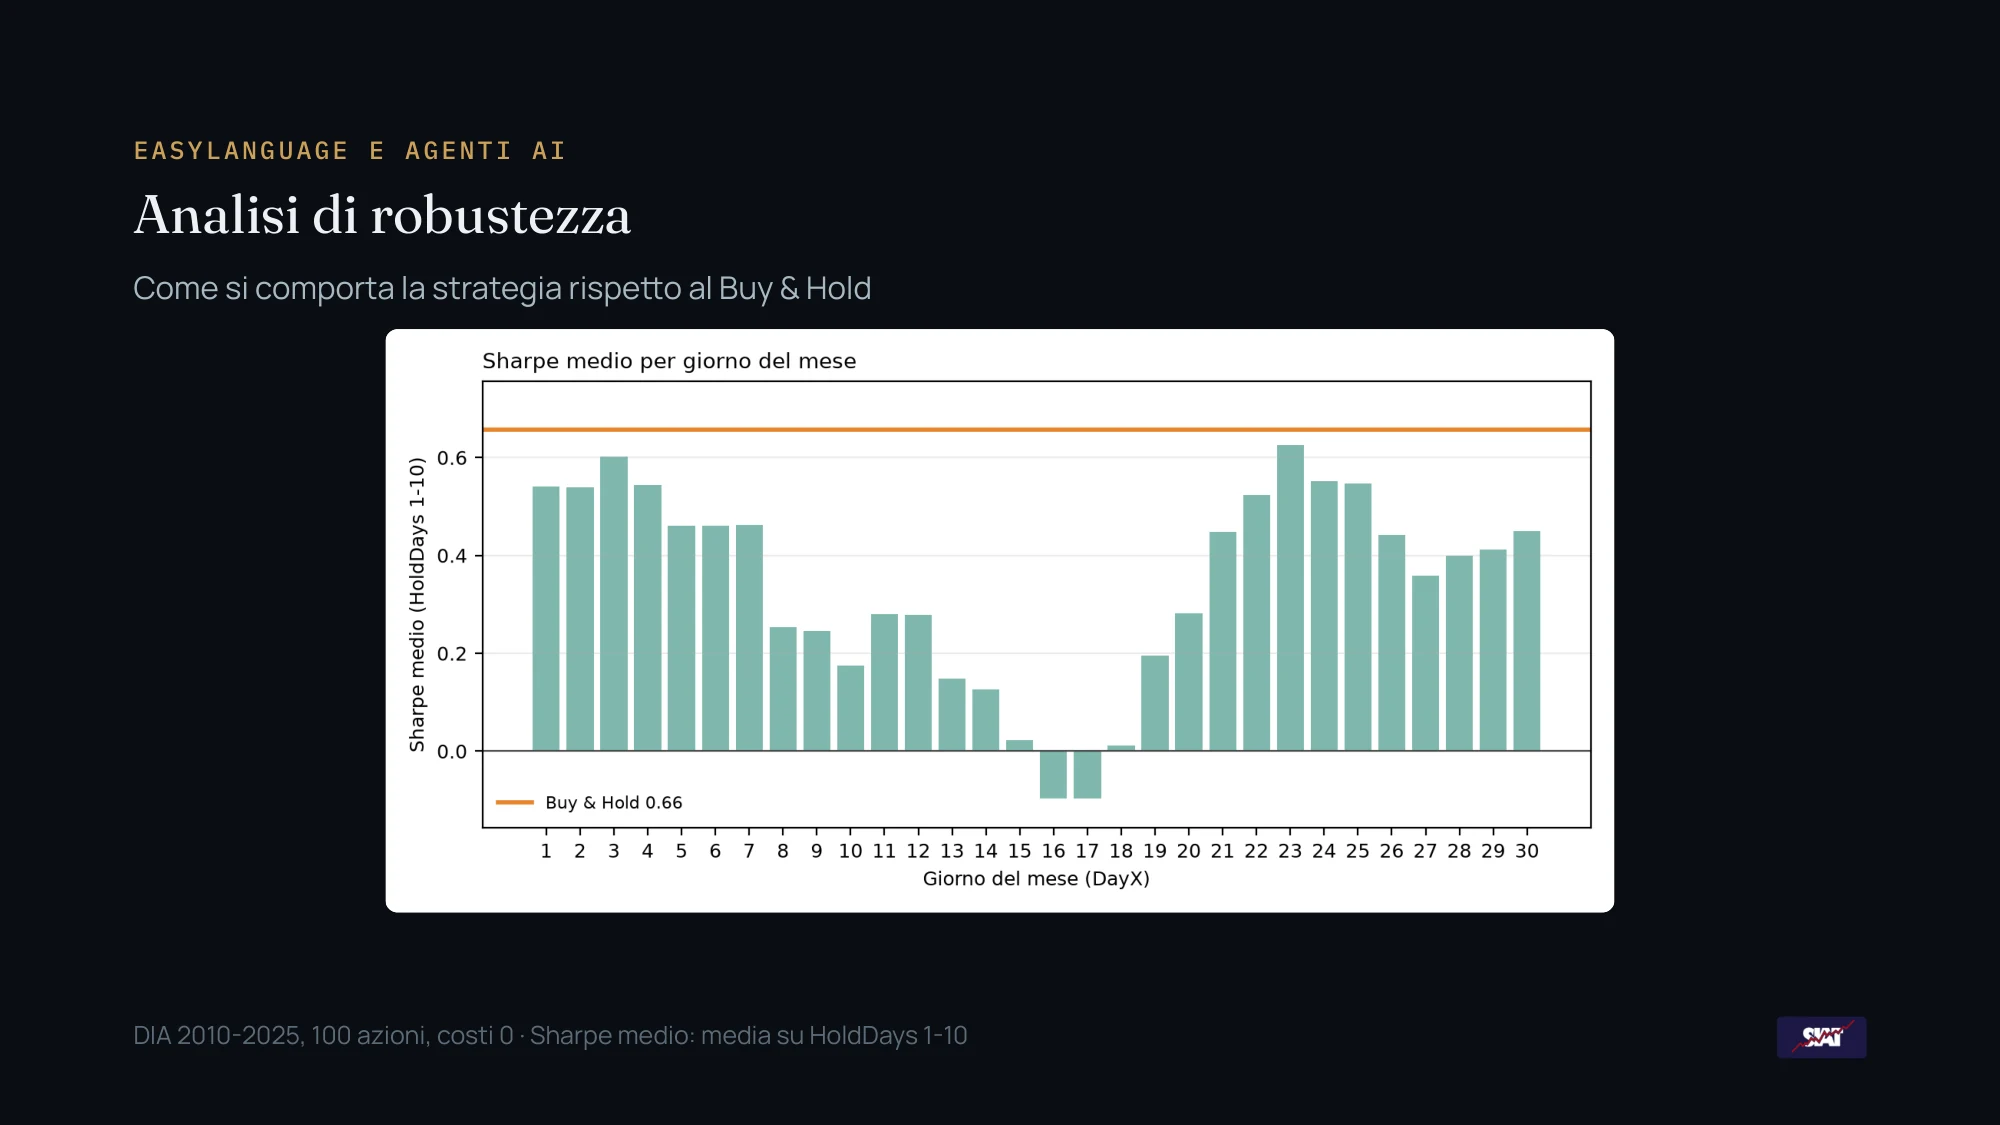
Histogram of the average Sharpe by entry day of the month on DIA, with the buy and hold line at 0.66
Slide 15. Average Sharpe by DayX, DIA 2010-2025, 100 shares, costs 0, averaged over HoldDays 1-10. None of the 30 days beats buy & hold (0.66): the maximum is on day 23 (0.63), the minimum on day 16 (-0.10). Two good zones, start and end of the month, and a weak zone in mid-month: this is seasonality within the month.
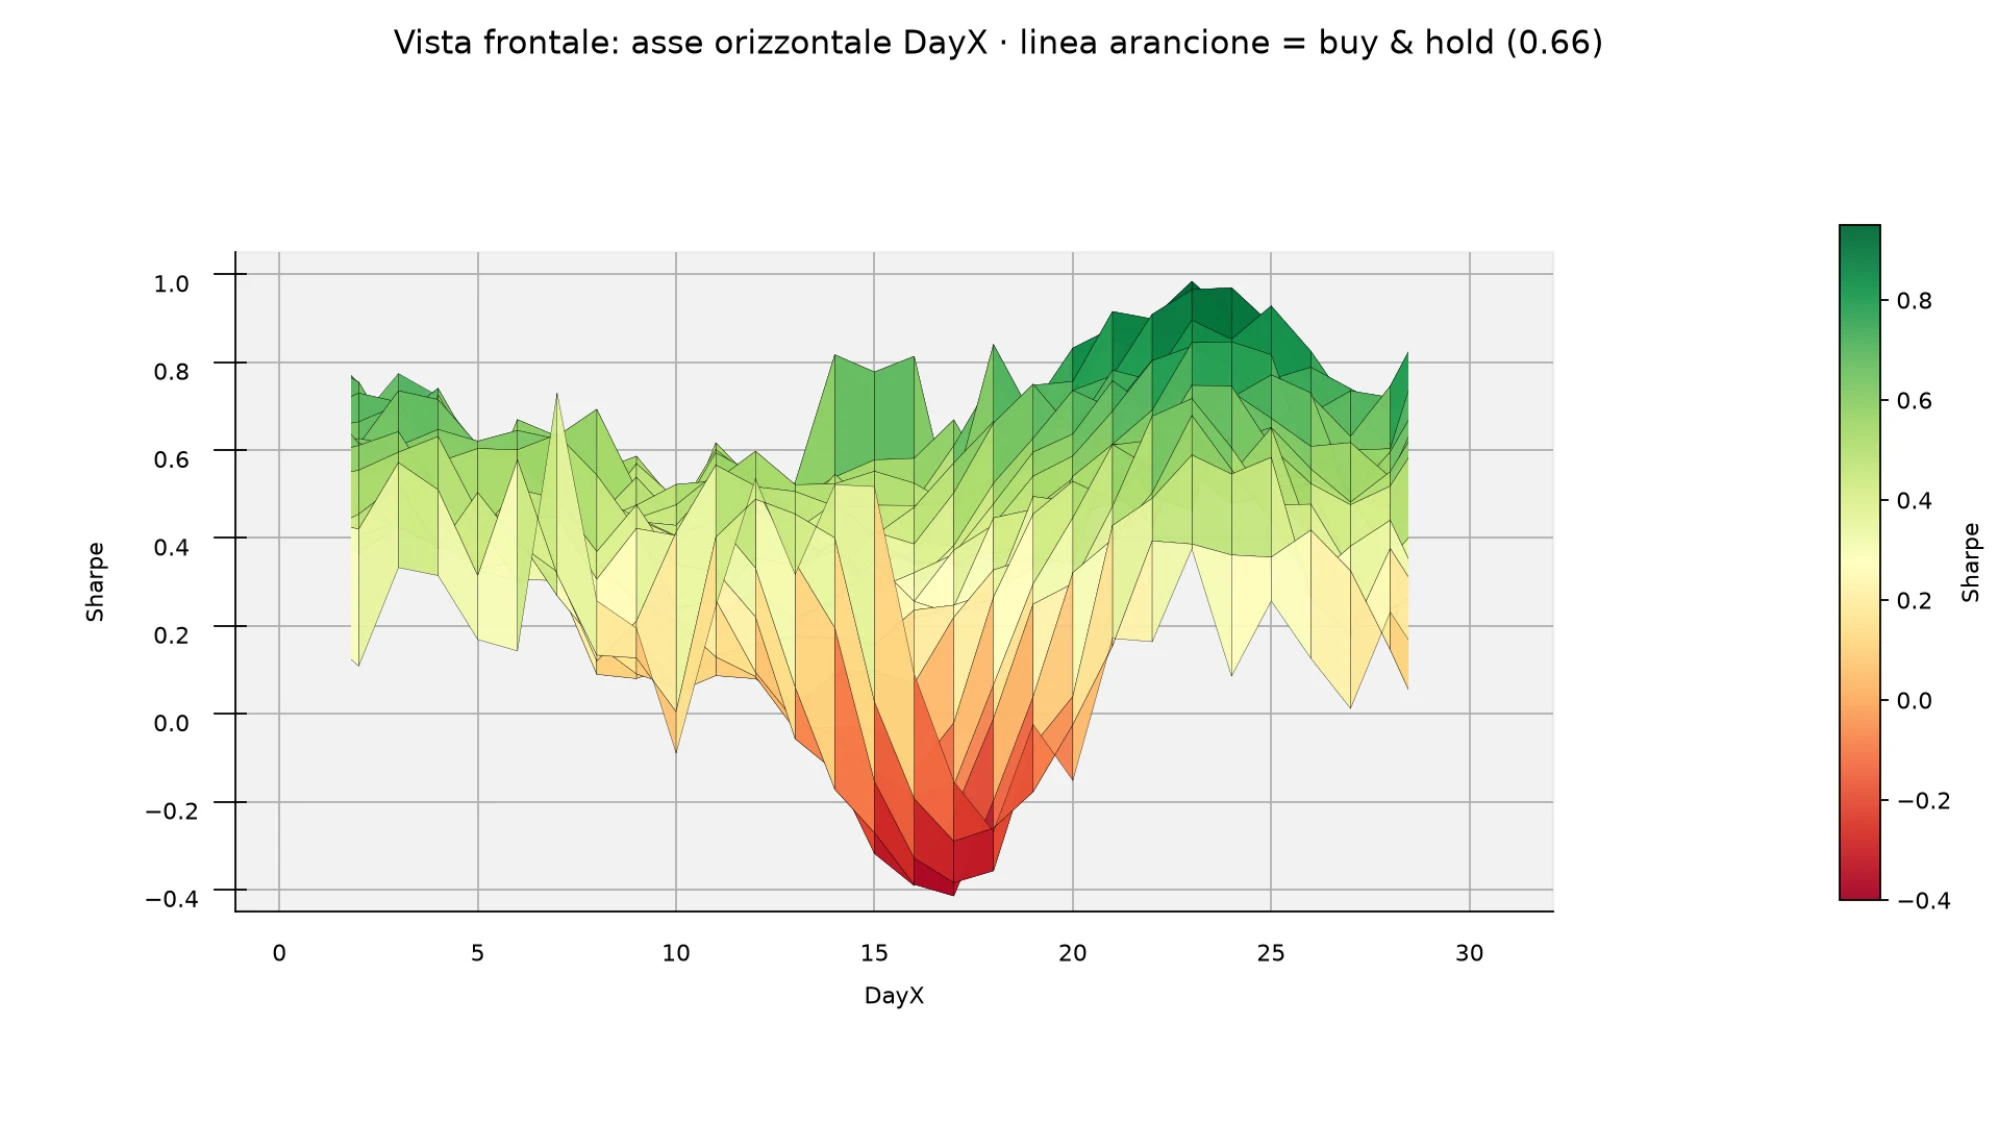
Front view of the Sharpe surface with DayX on the horizontal axis: minimum in mid-month and peak at month end
Slide 16. Front view with DayX on the horizontal axis. In mid-month (days 14-18) the surface drops to -0.41; at month end (days 21-25) is the highest zone, with the peak of 0.98 on day 23.
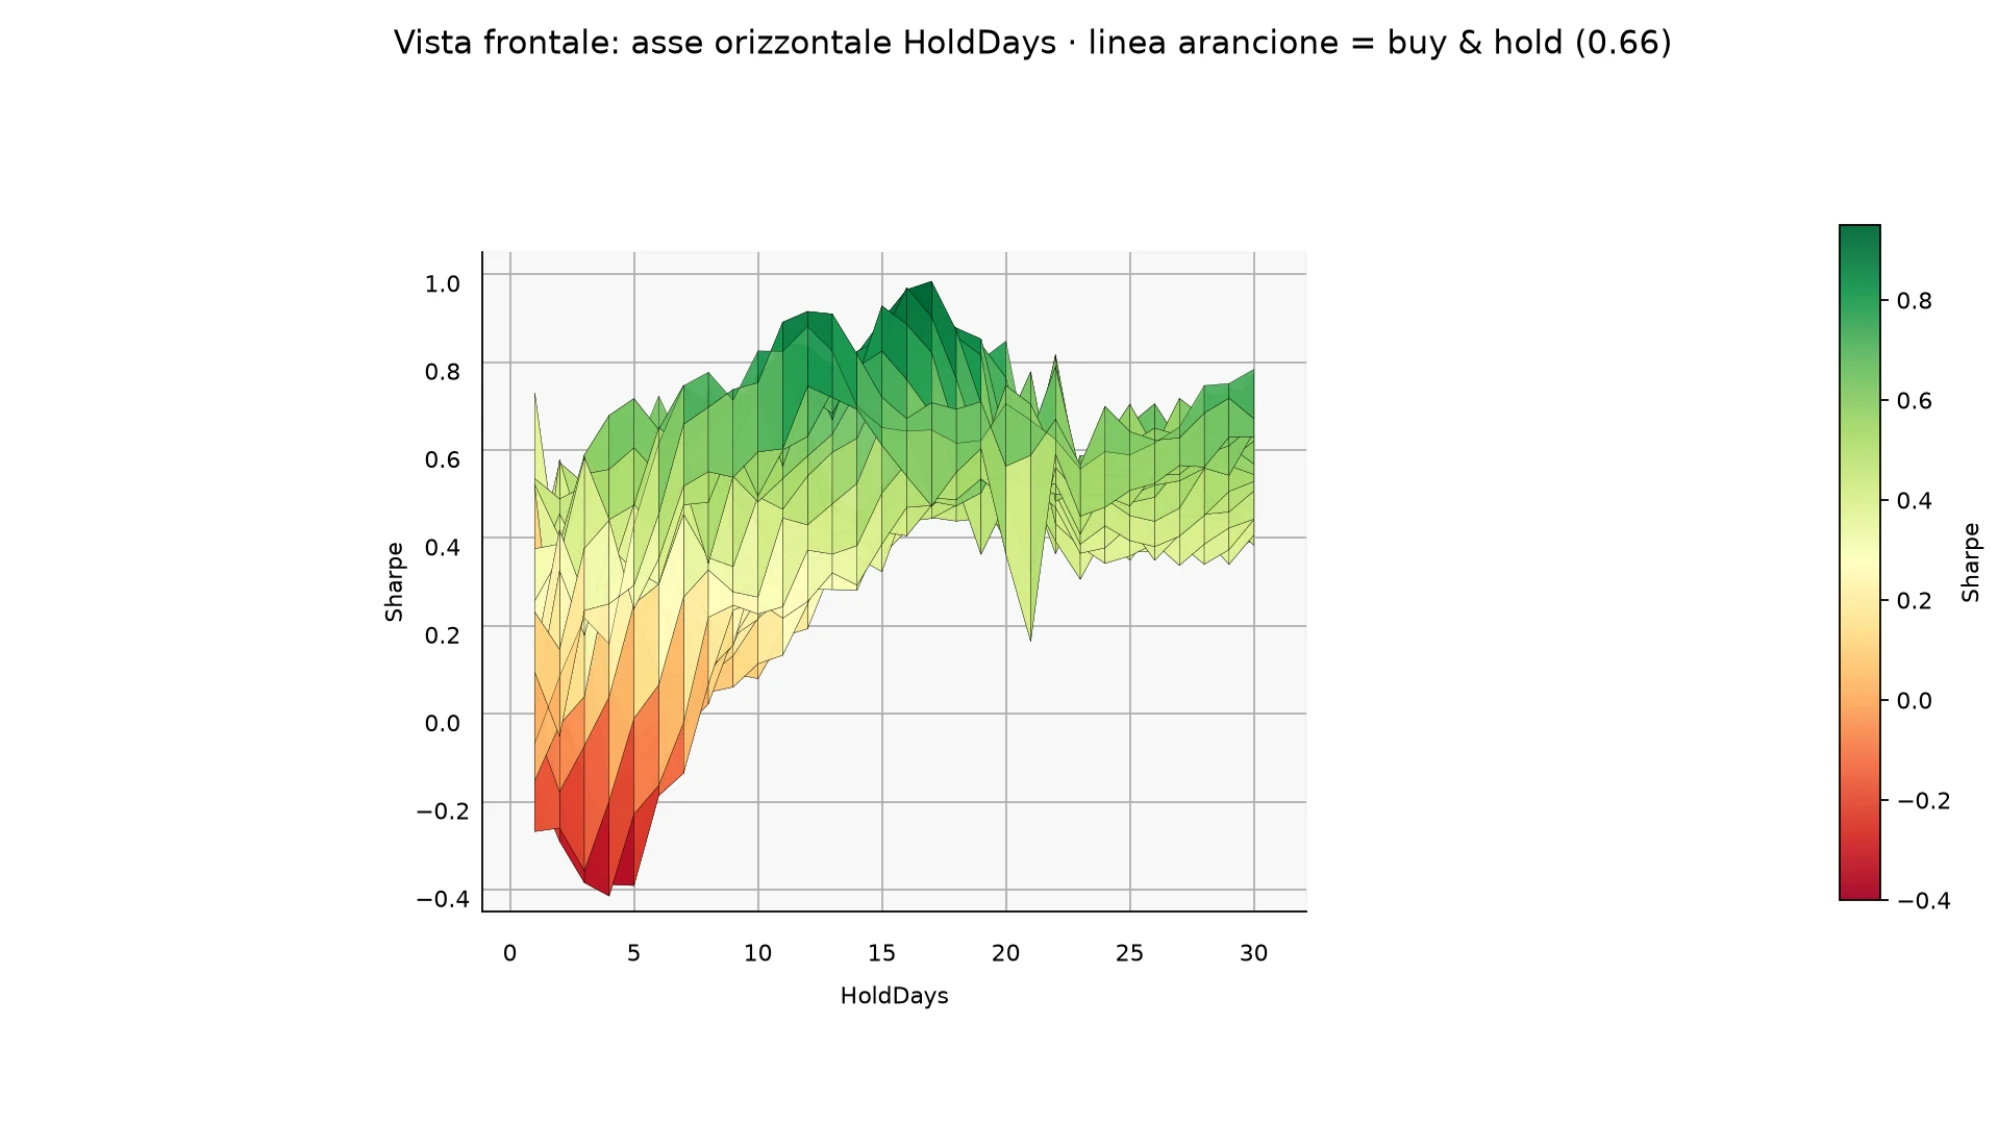
Front view of the Sharpe surface with HoldDays on the horizontal axis: low Sharpe with short holdings and stable beyond 12 days
Slide 17. Front view with HoldDays on the horizontal axis. With holdings of 1 to 5 days the Sharpe is low and scattered; beyond about 12 days the surface rises and stabilizes, with the average between 0.47 and 0.61.
3D surface of the grid search on DIA: Sharpe by DayX and HoldDays with the orange buy and hold plane
Slide 18. Sharpe surface by DayX and HoldDays; the orange plane is buy & hold (0.66).

Choosing the strategy and returning to EasyLanguage

This is where the trader decides. The grid search numbers guide the choice, but the rule to take to market is chosen by the person who trades.
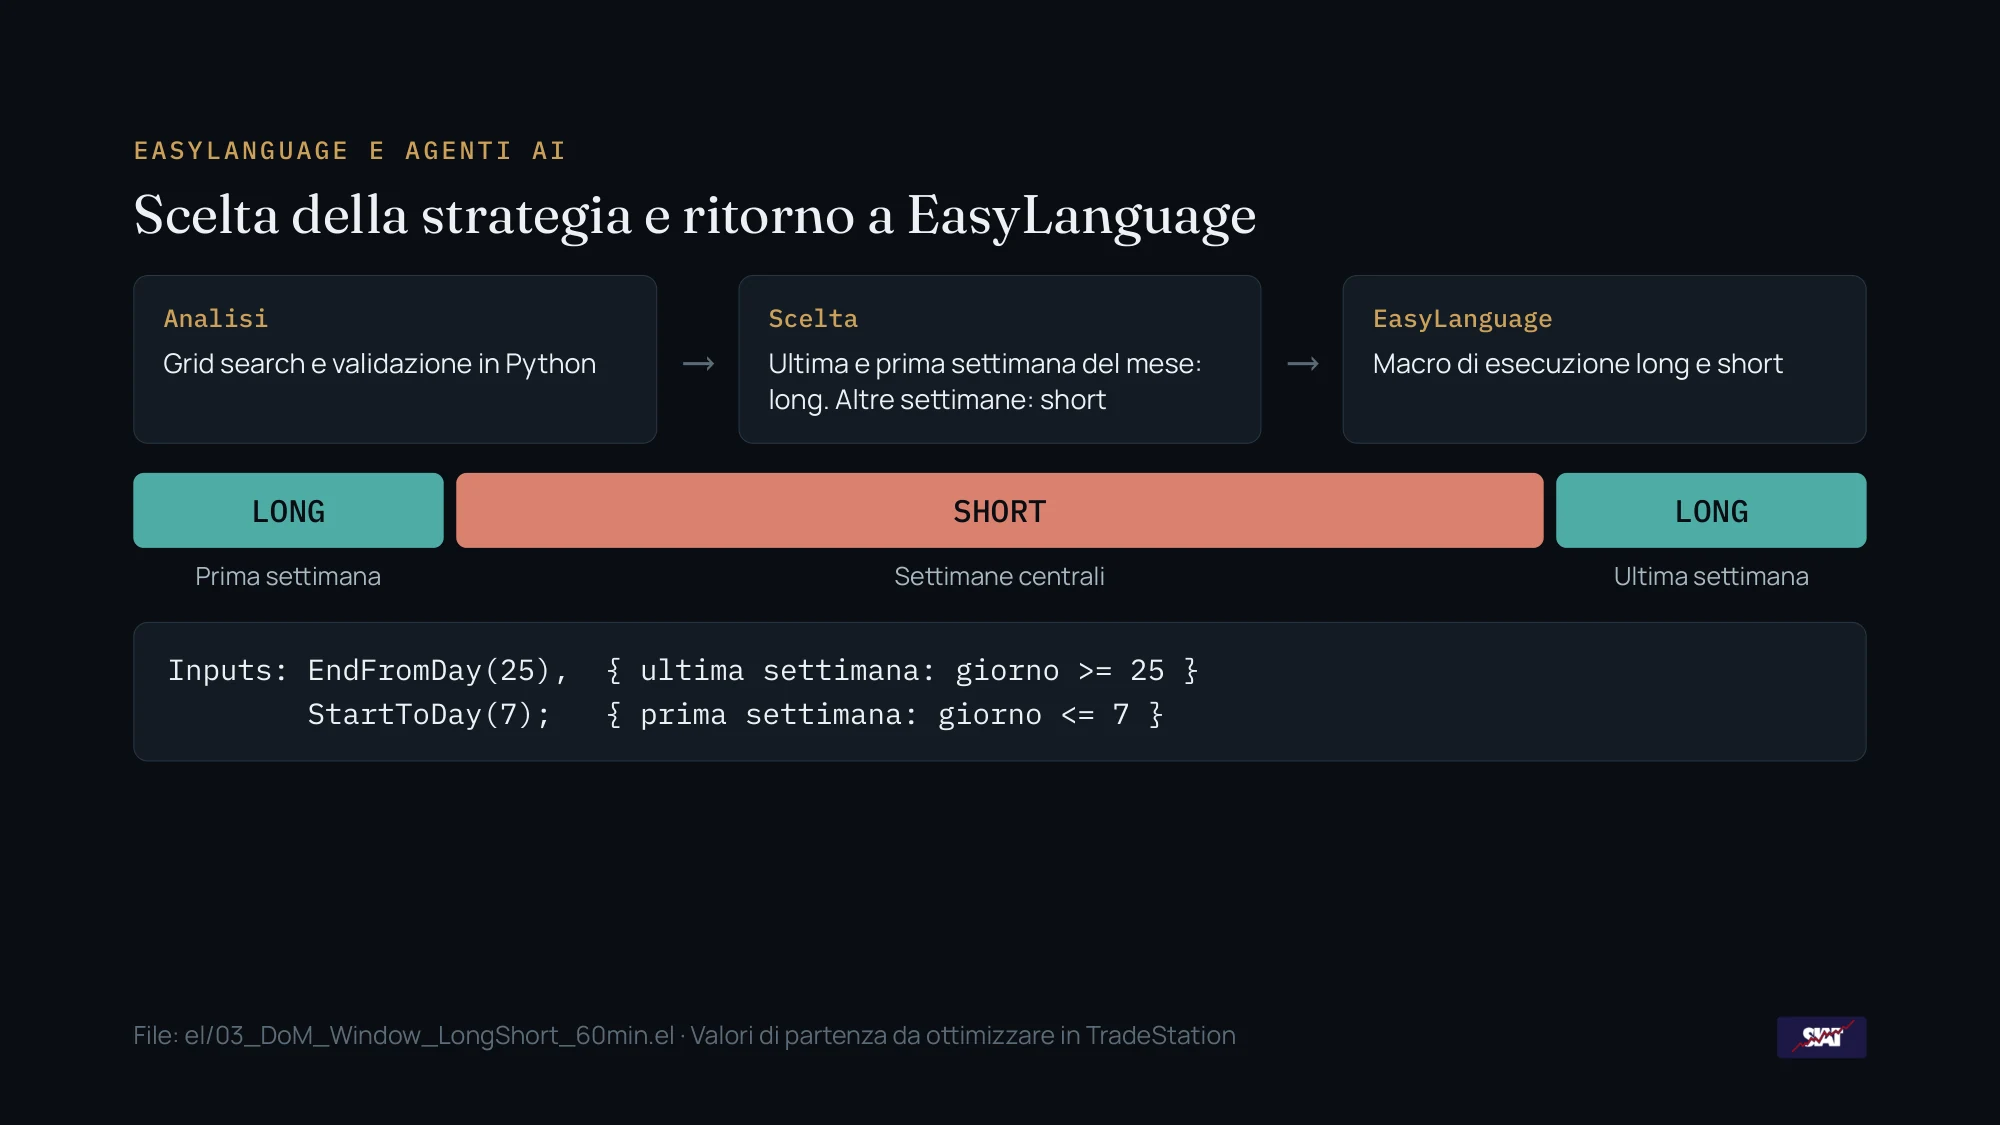
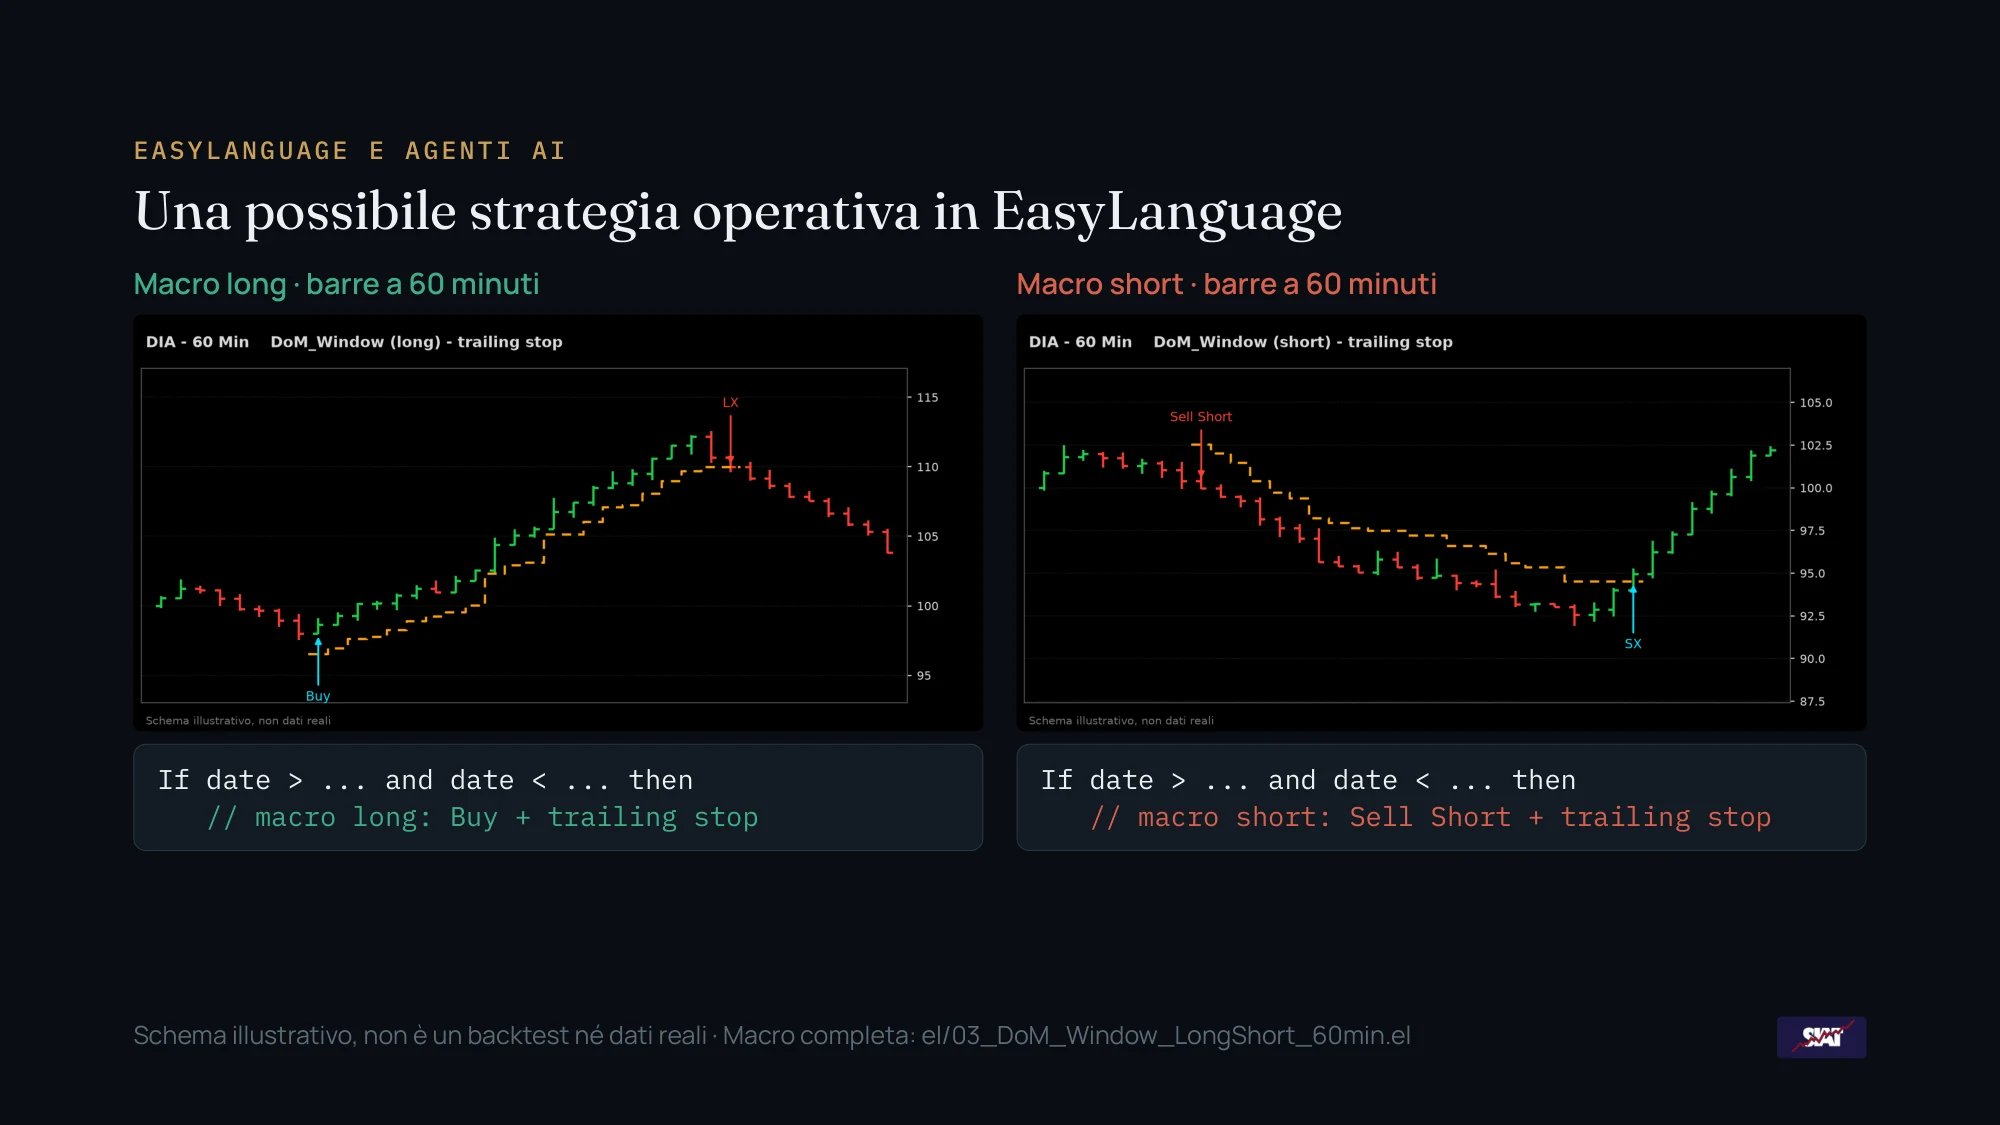
Diagram: Python analysis, choice (long in the last and first week of the month, short in the others), execution macro in EasyLanguage
Slide 19. In the last and first week of the month the setup is long; in the other weeks it is short. Window in calendar days: last week from day 25, first week up to day 7. These are the starting Inputs of the macro, to be optimized in TradeStation.
Illustrative 60-minute bar diagrams of a long macro and a short macro with trailing stop, with the related EasyLanguage pseudocode
Slide 20. A possible operating strategy in EasyLanguage: two blocks with a date range. In the last and first week the long macro runs, in the other weeks the short macro. The two charts are illustrative 60-minute bar diagrams, not real data. The trailing stop is a variant to add and verify in TradeStation before going to market.

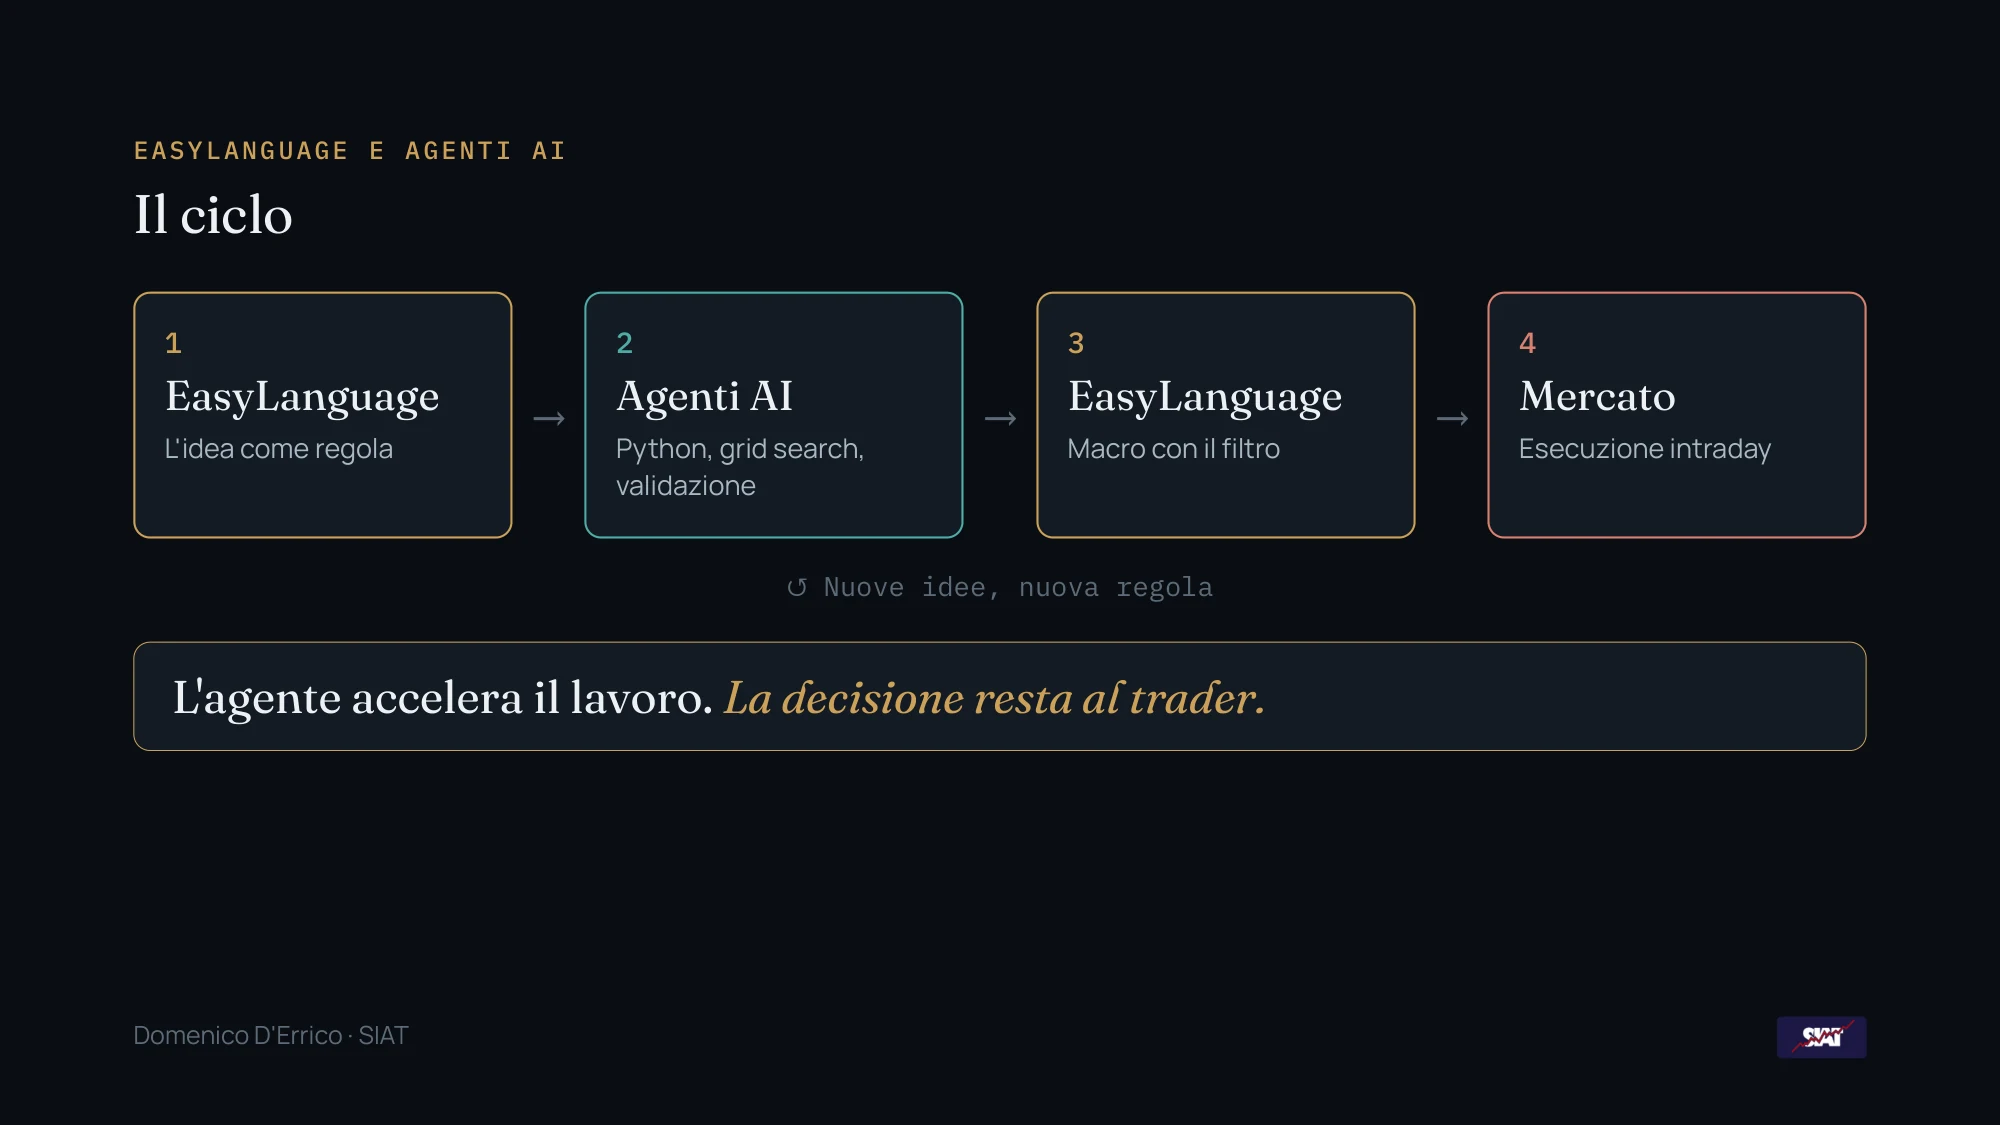
The cycle

The cycle: EasyLanguage, AI agents, EasyLanguage, market. The agent speeds up the work, the decision stays with the trader
Slide 21. EasyLanguage, AI agents, EasyLanguage, market. The agent takes the idea to a basket and validates it; the trader chooses and takes the rule to market.
  • A simple rule written in EasyLanguage can be taken by the agent to a basket and validated.
  • The TradeStation report is not enough: the comparison with buy & hold and the robustness analysis are needed.
  • On DIA monthly seasonality no day beats buy & hold in Sharpe, but the start and end of the month are the best zones.
  • The agent speeds up the work. The decision stays with the trader.

For more information: info@tradingalgo.it

Content for research and educational purposes. It does not constitute advice or a solicitation to invest. Backtest results do not guarantee future results. DIA data 2010-2025, 100 shares, costs 0.