No change. The model’s own mix, Technology 40% / Energy 60%, is close to what the portfolio holds (2.8% of the portfolio apart), so the portfolio stays put. Financials and Cash remain at zero.
Performance
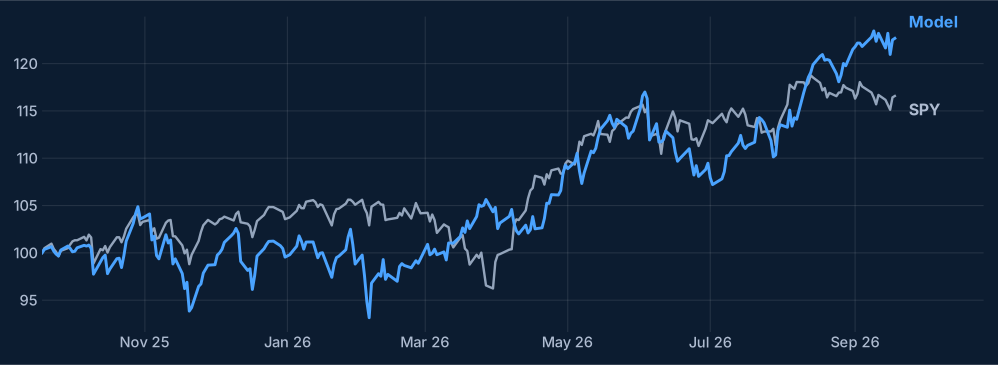
Model portfolio against SPY, total return, after assumed trading costs.
Where the portfolio stands
Weights at the close of each period, the week’s return of each block, and what each contributed to the portfolio.
| Block | Start of week | End of week | Week return | Contribution, pts | Model mix |
|---|---|---|---|---|---|
| Technology XLK | 37% | 37% | +1.0% | +0.38 | 40% |
| Energy XLE | 63% | 63% | −1.3% | −0.81 | 60% |
| Financials XLF | 0% | 0% | −2.4% | 0.00 | 0% |
| Cash | 0% | 0% | — | — | 0% |
The model mix is what the rule would hold today if it were rebuilt from scratch. The gap to the portfolio is too small to justify a trade.
The week
A choppy week. The worst day was Wednesday 16 September (−1.8%) and the best Tuesday 15 September (+1.3%). Technology (+1.0%) contributed +0.4 points; Energy (−1.3%), which made up 63% of the portfolio at the start of the week, contributed −0.8. Financials, not held, returned −2.4%. On the week the portfolio lagged SPY.
| Day | Portfolio | SPY |
|---|---|---|
| Mon 14 Sep | −1.3% | −0.4% |
| Tue 15 Sep | +1.3% | −0.5% |
| Wed 16 Sep | −1.8% | −0.4% |
| Thu 17 Sep | +1.3% | +1.1% |
| Fri 18 Sep | +0.1% | +0.1% |
What the model says
Every week the model reviews the past year and works out the mix it prefers. Today it points to Technology 40% / Energy 60%. That is 2.8% of the portfolio away from what is held, well short of the gap that would trigger a change, so the portfolio is left as it is. The last change was on 6 February 2026.
Twelve months of composition
The dotted lines mark the 4 changes of the past year.
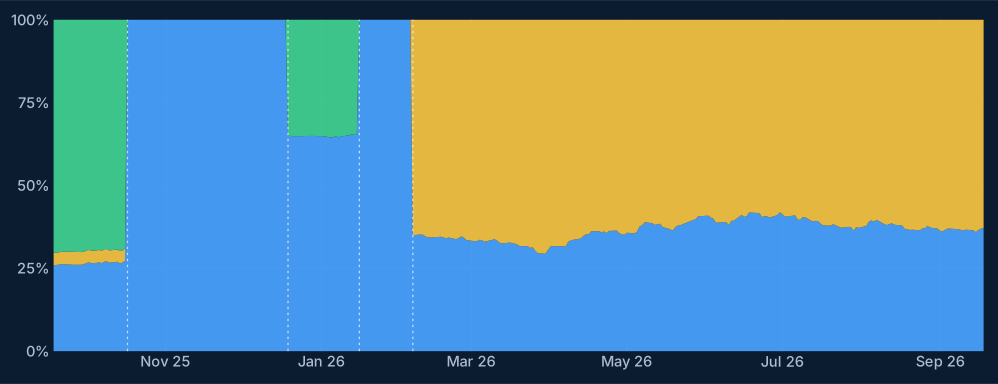
| Change | Before | After |
|---|---|---|
| 17 Oct 2025 | 27 / 4 / 69 | 100 / 0 / 0 |
| 19 Dec 2025 | 100 / 0 / 0 | 65 / 0 / 35 |
| 16 Jan 2026 | 65 / 0 / 35 | 100 / 0 / 0 |
| 6 Feb 2026 | 100 / 0 / 0 | 35 / 65 / 0 |
Weights in Technology / Energy / Financials, % of the portfolio. Cash was zero throughout.
Model against SPY, twelve months
The last six weeks
Weights at the close of each week, the return of the week, and the mix the model preferred that day.
| Week ending | Portfolio | Portfolio return | SPY | Model mix |
|---|---|---|---|---|
| 14 Aug | 38 / 62 / 0 | +5.1% | +0.4% | 35 / 55 / 10 |
| 21 Aug | 37 / 63 / 0 | +0.4% | −1.4% | 35 / 55 / 10 |
| 28 Aug | 37 / 63 / 0 | −0.5% | +0.5% | 35 / 55 / 10 |
| 4 Sep | 37 / 63 / 0 | +1.7% | +0.1% | 35 / 55 / 10 |
| 11 Sep | 37 / 63 / 0 | +1.1% | −0.8% | 35 / 60 / 5 |
| 18 Sep | 37 / 63 / 0 | −0.4% | −0.1% | 40 / 60 / 0 |
Weights in Technology / Energy / Financials, % of the portfolio.
Research material only — not personalized financial advice. The model portfolio is a simulation of the rule described in Sectors Allocation, with assumed trading costs of 0.10% of each amount traded; it is not a real account. Returns use daily closes with dividends reinvested. Past performance does not predict future results. Contact: domderrico@gmail.com